Breakout of SPY to new all-time-high
Do you know what I wrote about the SPY in my last weekly summary?
[…] For me, those elements together are building a bullish scenario increasing the probability of a breakout to a new all-time-high. […]
Alexander
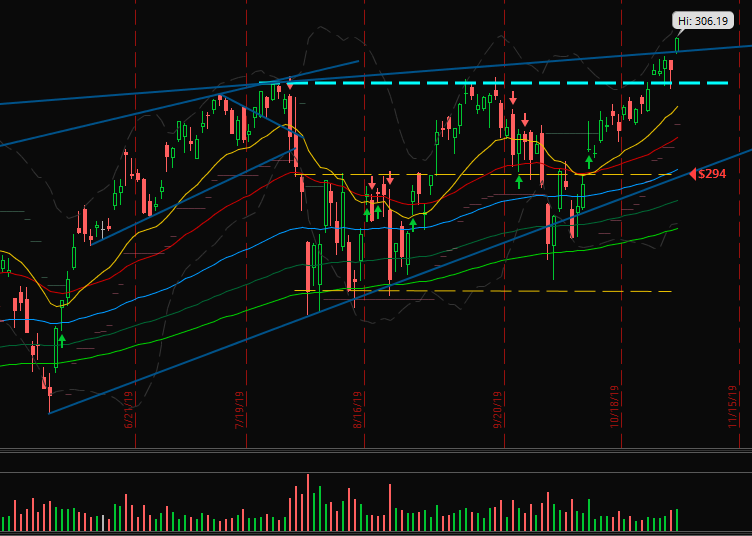
And it broke out! The SPY reached a new all-time-high at 306.19 and that’s almost the close of Friday and therefore the close of the weekly candle.

As you may know, a close almost at the high of a candle stands for a bullish scenario.
We already had a little healthy pullback with Thursday’s red candle and the open/low of Friday’s candle was exact at the monthly trend line connecting the highs since January 2018.
Because of all those conditions giving us bullish signals I expect the SPY moving higher at least for two days next week.
Checking my new position
The sideways market since 2018 was difficult for swing trades. Last weeks more than before. Therefore I am happy about my decision:
Started during my vacations this summer I am trading only the best setups now. Therefore it got calm in my trading journal but the results are better.
This week I only added a second position to my relatively new first MCD long term investment.

The stochastic in the weekly chart for MCD is very low (12.8, 18.2). So I added another little position exactly at the bounce of the 61.8% fibonacci level.
While the US McDonalds website promotes free delivery on Halloween, the European McDonalds does not have any delivery features yet. Because of the growing food delivery market all over the world there is lots of potential for MCD to grow over the next years and decades (not supported by my vegan and sugar-free shopping basket).
In addition to that we recognize an tremendous growth of the operating cashflow (last quarters: 1338.8, 2471.1, 1511.6, 2020.6, 1925.5, 7928.8) and the net income (last quarters: 1496.3, 1637.3, 1415.3, 1328.4, 1516.9, 5897.9) in the last earnings report.
And of course, it will help that the SPY reached a new all-time-high with a breakout of the long range market.
Let’s looking back
In the following three sections I will analyze the charts of YUM, FB and UNH, my new long term positions of the last weeks. You can re-read the articles of my weekly summaries to get an idea of my former thoughts.
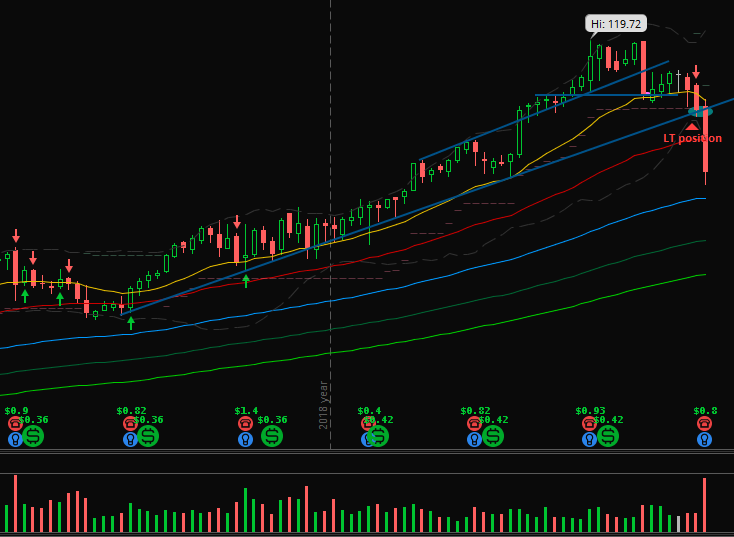
#1: For YUM I do not have to write a lot. Just look at the chart to recognize my worst entry for the first position:

I do not add another position yet because I am unsure of the progress of price action the next weeks. In the daily chart YUM formed a huge gap down and I’ll just book it as an unfavorable entry price. 🙂
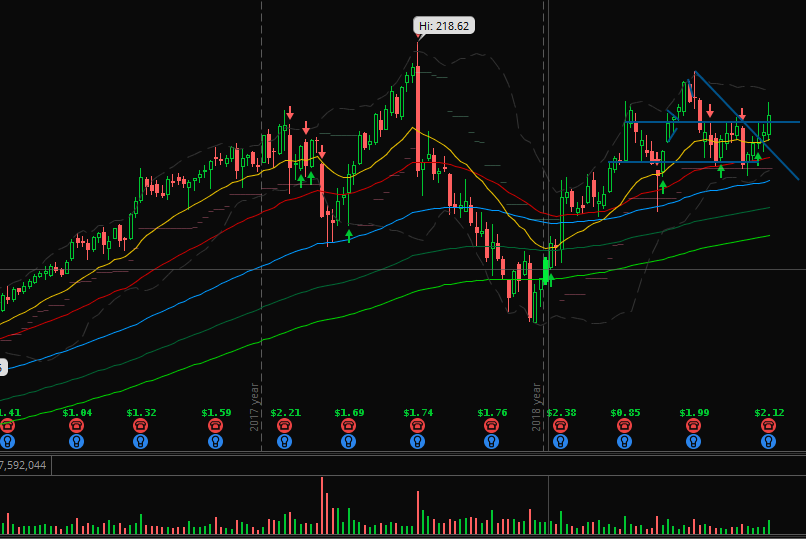
#2: However, I was a little surprised that FB left the range last week. I expected a more bearish price action for one or two weeks but with a little more volume it could be the first weekly candle of a new move upwards:

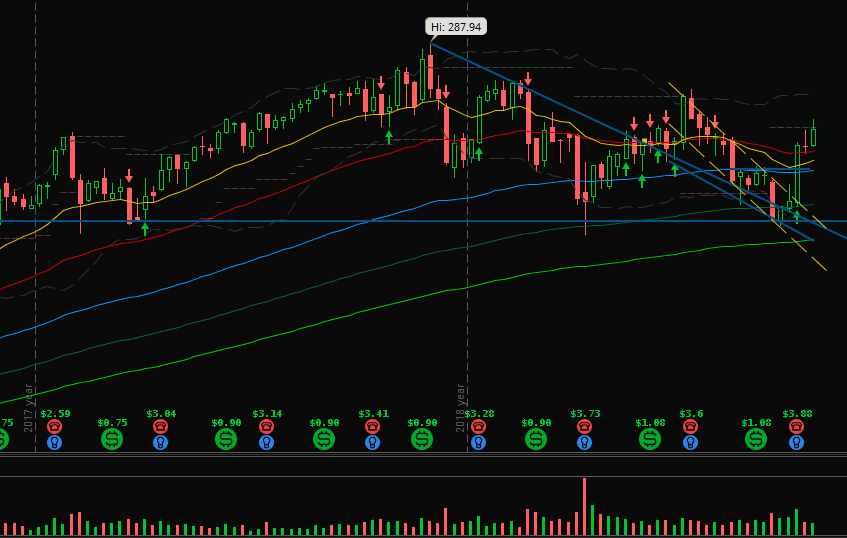
#3: With my UNH position I made up for the creepy entry of YUM. I bought it exactly at the last low. Maybe with the momentum of the market a new high will be reached:

So, that’s it for today!
Did you enjoy my weekly summary?
The newsletter system is installed now and so you can subscribe from now on. I would like to inform many of you, my readers, about new articles, new features and about my tools I am transferring from my local Python to an online interface step to step to make your trading easier.
Please, comment below about your thoughts, opinions and experiences. I will answering every comment.
Now I wish you a happy week, a good start into November and good entries and exits. Bye!


9 Comments
Paul LaRocca
(2. November 2019 - 19:43)I think for YUM, you simply forgot to check that quarterly earnings we’re coming out. At least the 50 SMA is likely support, if necessary.
Alexander
(2. November 2019 - 21:41)Yes, you’re right, Paul. I marked the level some weeks before my entry. And when the stock reached the level, I just bought without re-checking anything.
But like every little mistake in trading and investing, I will learn from it. 🙂
Paul LaRocca
(2. November 2019 - 21:50)Easily correctable mistakes are the best kind. ?
Justin
(5. November 2019 - 18:12)Do you think is a bluff, it would go down quicker soon? It seems China US trade war not ended and Brexit is still coming!
Alexander
(6. November 2019 - 10:10)Welcome Justin at MARKET AND US and thank you for your first comment.
I (am trying) to trade what the chart is showing me and for long term the fundamental data. The probability is high for some red candles because of the strong move upwards. Therefore the “rubberband” is stretched and it is more likely to have lower prices the next day.
After that the SPY can form a pullback on the breakout level showing us a good bullish setup or it can break down again and then we have to pay attention for a re-test of the level from below.
Like I wrote in the article above, I expected at least two green days. We did not see them because on Monday SPY had a gap up and formed a little consolidation. We should pay attention on a next bigger candle: upwards green or downwards red. With this scenario (between Tuesday and Wednesday) I am expecting at least a pullback. Maybe on Friday’s close the market will reach the breakout level to make our weekend exciting… 🙂
Alessandro
(15. November 2019 - 13:45)it would be interesting to know more about Relative Strength, and how to make use of it while trading, and how to pick stocks which show the best performance related to the SPY
Alexander
(17. November 2019 - 11:25)You mean an article about the importance of Relative Strength for trading and picking stocks?
Yes, that’s possible. I could combine my knowledge and experience for trading and for coding Relative Strength. It’s noted down on my article list!
Alessandro
(5. December 2019 - 17:41)dear Alexander,
there have been discussions in the latest days, about which timeframe chart we should look at, when we are analysing a stock, from the technical perspective.
I notice that sometimes, when looking at daily charts we have one picture, and when looking at weekly chart we get a completely opposite picture. An example of this would be YUM today (12 December 2019).
In my opinion I should not be supposed to buy, if looking at daily charts (SMA crossing, Price below 200SMA: could be a signal of the beginning of a bear market)…instead, when looking at weekly candles the price is bouncing off the 50SMA, all SMA are sloping up.
My questions are the following:
– do you enter/exit a (fundamentally) valid investment based only on tecnicals? always based on technicals AND intrinsic value together?
– Would you enter an investment which is slightly overvalued, but with ideal technical signals?
– do you look at daily, weekly or monthly candles? and why?
Alexander
(5. January 2020 - 18:29)Check the new article for some of the answers please.