When you are reading articles about the stock market and also about other themes, please: Do not believe anyone!
For almost every field it’s important to doubt statements and to think about alternatives. Everyone can be wrong. Even scientific laws. And you will find out that you also should not believe all of my articles 😀 (of course, at some points you can learn a lot by adapting a professional. If you found a good mentor it’s good to copy her or him without any doubt at first).
Believe in price action
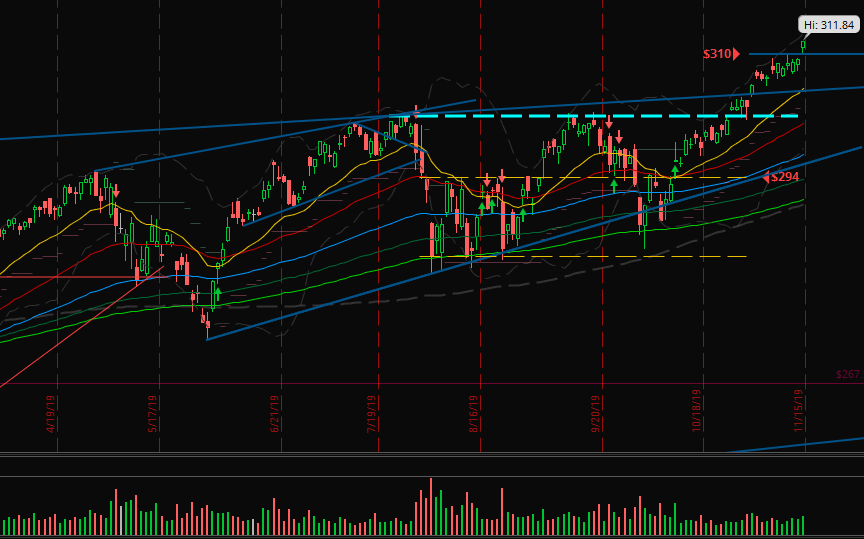
I expected the breakout with two days of bullish movement and I was right. But I didn’t expect the bullish movement without any reversals yet. On Friday SPY did broke through the resistance level of $310 I mentioned last week. And it’s a bullish green candle with its close almost at the high.
Do not believe me. 😉 I am trying not to predict anything and to write only about what price action is telling us. I am always honest and you will only read sentences I thought about several times before writing them. But it’s difficult. Trading is about probabilities and some say that the market is always doing the opposite of what traders are expecting:
In our example that would mean that SPY will go up as long as we are cautious expecting a move downwards and when we are confident to trade bullish the reversal will happen.
And so, it is more likely that we will see one or two bullish candles the following week. Then we have to pay attention on reversal patterns.
Let’s watch the charts and see what will happen …
One breakout and one reversal
This week I only took two new trades and no position was stopped out. I told you already that I changed my style and I just trade the best setups and patterns (in my opinion).
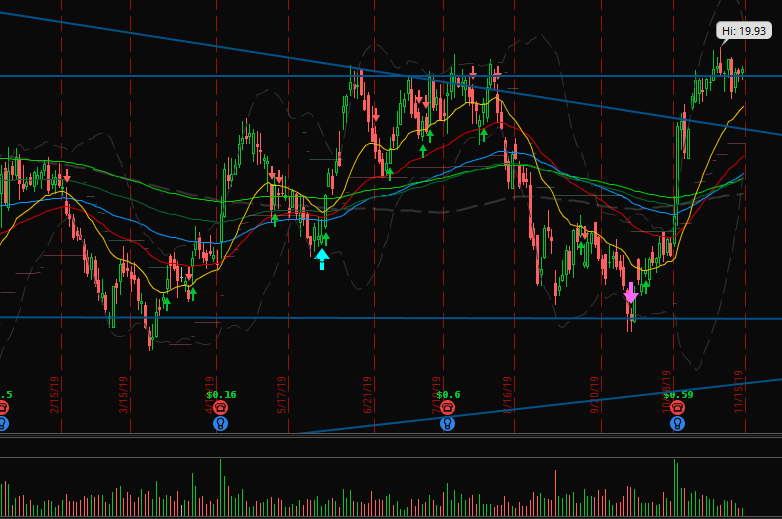
In the above image you can watch the chart of JBLU. I traded the breakout. Price slowed down at the counter trend line but then built a little wedge at the breakout level and broke out.
Yes, it’s a good momentum, but price is also little stretched. The wedge and the last candles created a consolidation, so it’s more likely to collect the power for a strong breakout than to reverse down again.
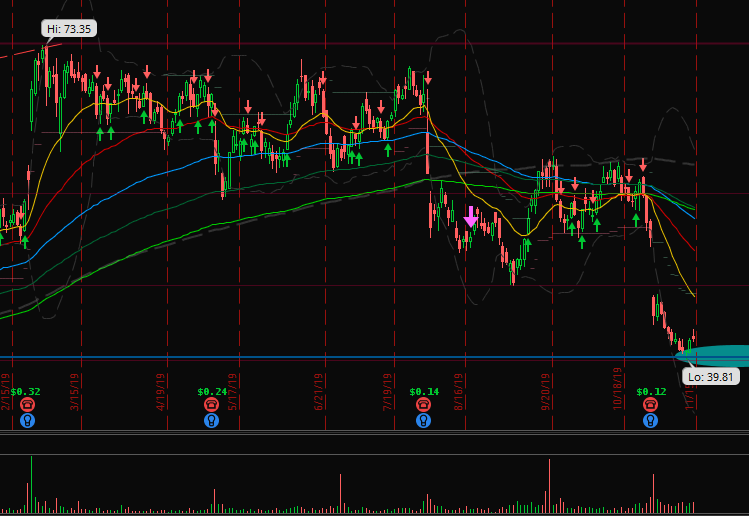
You should watch the weekly chart for ETSY (Etsy, Inc., the marketplace for creative products) in addition to the daily. Then you will recognize that the entry level has a high probability to become a low for the next weeks:
It’s a strong resistance over a long time and it’s the 50% Fibonacci level of the big picture. Price fell down fast and I didn’t wait for a confirmation and bought it above the high of the lowest green candle.
Now it looks like a re-test and maybe ETSY will build a double bottom next week. But you know: I won’t predict anything! 🙂
Not to write too many unnecessary words, I wish you a wonderful week, many lessons for becoming a better trader, good profits and always a smile on your face!
Remember to subscribe the newsletter to make me happy. 😉


3 Comments
Alessandro
(17. November 2019 - 22:45)since the market is all about probabilities, and since we can only analyze the market at the current situation, it would be interesting to know what you think about my current situation : I expect the SPX to make a pullback the upcoming days but I’m holding several long positions at the moment. Despite I think the SPY will stay bullish for quite a few weeks or even months from now, should I close my long positions, because of the bearish week that is gong to come, based on my analysis?
Alexander
(18. November 2019 - 09:24)Do you know that the SPY soon will move downwards and hit your stop losses?
Do you know that you will make more money on the long run when exiting your positions now?
If you answer both questions above with a “no” then you should stick to your system and avoid improvisation!
Update: For me, it’s always helpful to ask me what would be easier for me: If I stick to the rules and my stop loss is hit. Or if I am changing the rules and the price goes higher and higher after that …
Alexander
(21. November 2019 - 08:51)Update:
SPY built the first 2 red candles but yesterday a big lower shadow formed. The support of $310 was strong enough for a close above it. It is more likely to get a sideways range the next days. That would calm down the market and create a 50% probability for up and down moves. We’ll see.
I bought ITRI yesterday. Details in the next weekly summary.