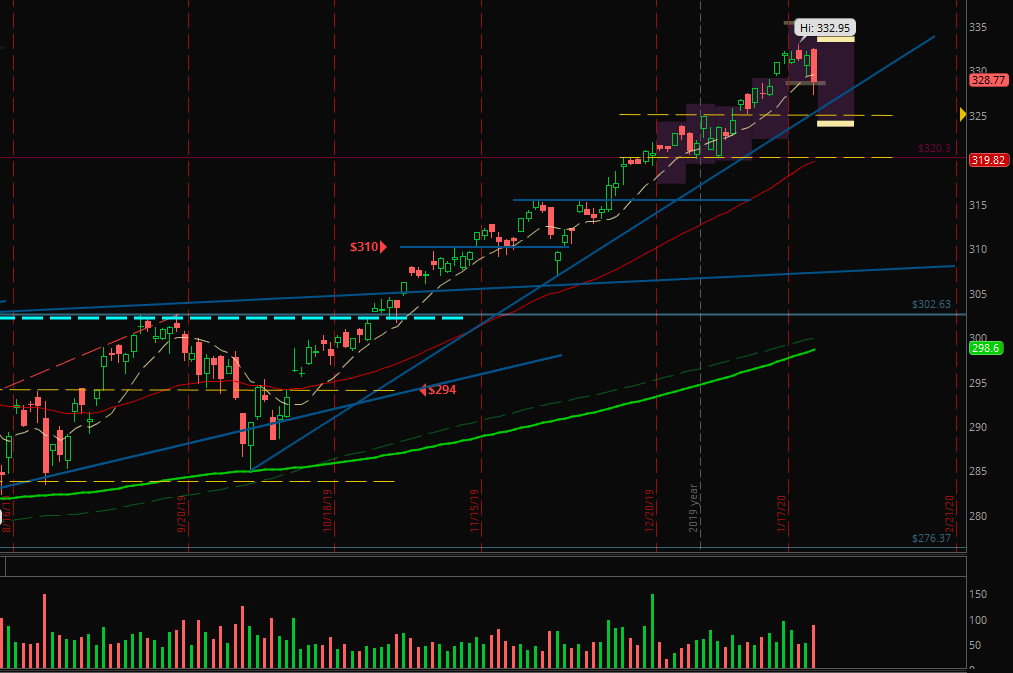
But now! Friday’s candle is the first bigger red one since the breakout above $300. You can read below why I expect the markets take only a little break.
Happy correction!

You could read in last week’s article that I expected a test of the $325 level in the next weeks.
Now there are two possible scenarios:
- Monday and Tuesday green and therefore sideways with little ups and downs between $328 and $334 for the rest of the week.
- Little correction with a test of the trend line and the support around $325 and $326. The next support levels would be $320 and $315/316.
So, I will pay attention on Monday’s price action and if the market participants are more bullish or bearish. But I will still take long trades if I find good setups.
Bought and sold…
I bought YETI last week and added to my TGT position after the big gap down to participate the move upwards or being stopped out with just a little more loss if it will fall lower.
The position in DEA hit its first and second target on Monday and Thurday.

Such a short article about markets taking a little break?
Yes, I am sorry. But I couldn’t work on any trading tasks yesterday. But I thought it’s better to create a little article than no article. 🙂
A wonderful and healthy week and let’s see what the stock market will do!


