We had two days to the -20% level but then again the bulls got a bullish EOW (end of week).
You will read in the following article about Fibonacci and my last two long term buys. But first the market overview:
Market
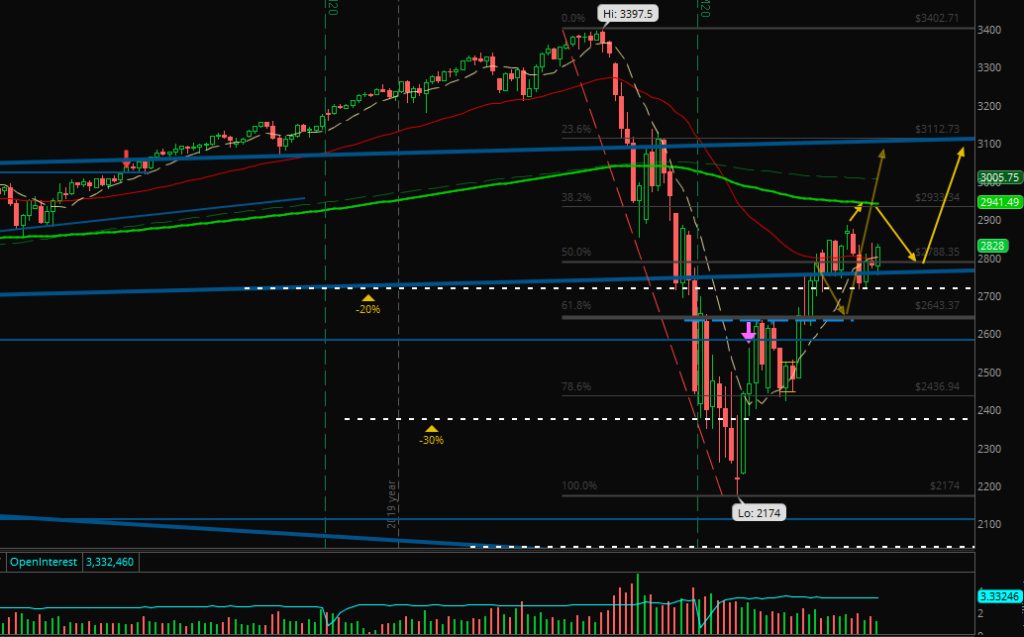
You see that my expectation has not changed a lot. I could imagine a move to the 250 EMA / 200 SMA / 38.2% and then down again. But it’s likely that we will stay in the channel again:

Of course, the market participants currently try to find the true value after the expectations for most companies were cut. Also, the injections of the central banks will be decreased soon. That’s the reason why I expect much lower prices again in some weeks.
Maybe you would draw the Fibonacci lines the opposite direction with the 0% at the bottom and the 100% at the high. But the levels are at the same price. I drew it that way because I wanted the extensions to be at the bottom. For me, a newer all-time-high has a very low probability, so I need lower targets much more.
How the Fibonacci levels fit exactly to the price movement during the correction:
- 23.6% = first lower high after the strong move down began
- 38.2% = first lower low and current possible target (=250 EMA currently)
- 50% = range because bulls wanted to get higher and bears to reverse downwards
- 61.8% = first high after the move up from the bottom and current possible pullback level
- 78.6% = first low after the bottom
In short: For me, the meaning of the Fibonacci lines is much more helpful than I thought. Especially for the indexes – in all time frames.
Portfolio
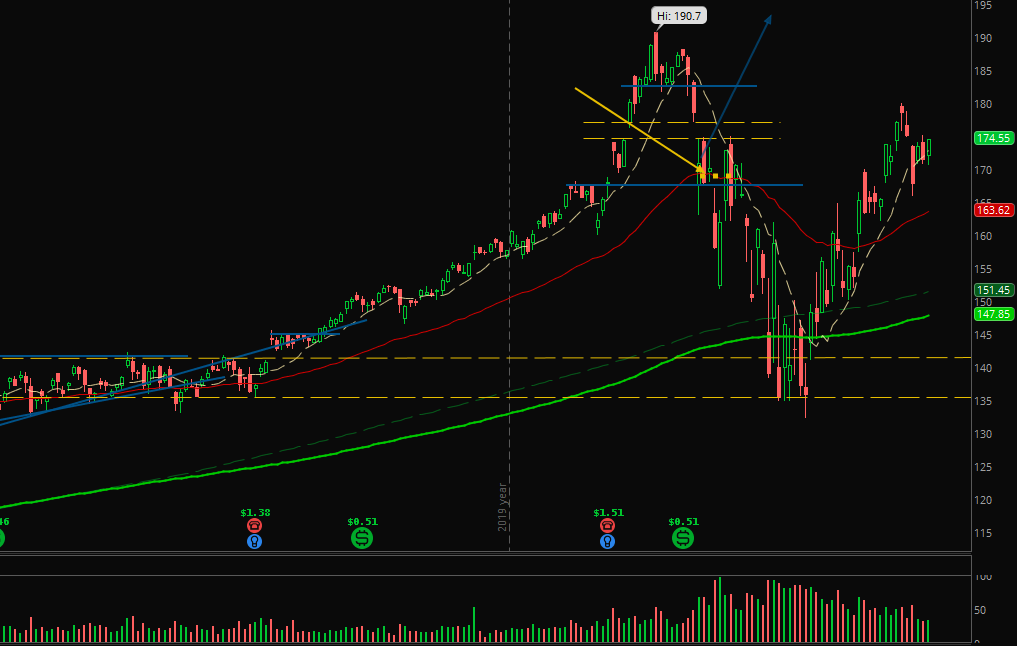
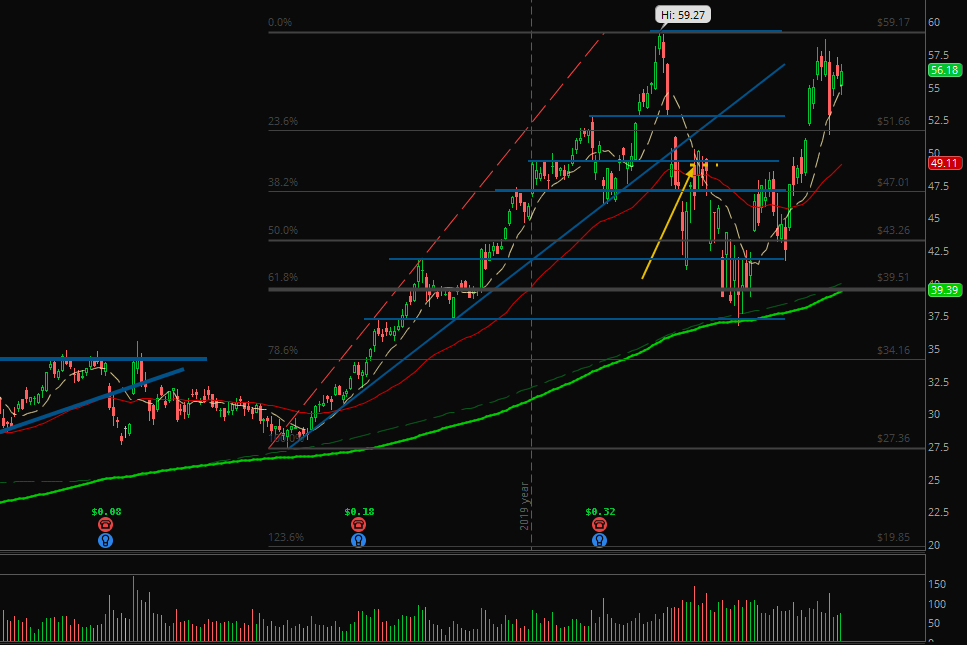
Today I want to show you the two last positions I bought at around 50% on the way down to the low:

My position in MSFT had been much better timed but I am in profit. If I had paid more attention on the channel I had on my chart before a new partial could have been a good idea.

AMD moved very nice to the upside. Also, you can see the bounce on the longest moving averages, almost touched in last October.
I have some medium term or newer position listed where I think about taking partials before the next bigger move down would take place.
Futures
Although the last week was a good one, there was one trade on Wednesday I made lots of mistakes and had a loss of -$200 in paper.
But I reached the next level in futures trading because I saw the best patterns every day and on Thursday and Friday I started to try trading them longer – and to avoid the choppiness between. Because of this new perspective I decided not to trade live for the week.
Last Week:
• Live account: +$0 (no change)
• Paper account: -$104.77 (3 green days, 1 break even, 1 red)
This Month (April):
• Live account: -$100.08
• Paper account: +$6.98
Also, I recognized more and more that my computer system is at its limits and my charts are sometimes frozen for seconds – dangerous for live trading. So, I have to think about buying a better computer or use a second partition on the same hard disk optimized for trading.
What improved my trading wasn’t only the Fibonacci lines like I mentioned above. It was also to pay much more attention on the previous close, high and low. Powerful price levels and I recommend to watch them during day trading sessions.
My goal for next week hasn’t changed: 5 green days in paper and live.
Did you like my lines about Fibonacci and my last two long term buys?
Let’s read next week!
And until then: Stay healthy, stay green.


6 Comments
Paul LaRocca
(25. April 2020 - 17:34)I agree that the previous day’s high and low are very strong support/resistance. I highlight yesterday’s range in a different color so that it’s very obvious when today’s price is approaching those levels.
Alexander
(26. April 2020 - 13:49)Good idea. My broker software has not such a possibility.
But I would try it if it has.
Alessandro
(26. April 2020 - 11:19)dear Alexander,
it’s always a pleasure to read from you, your weekly articles are rich of interesting ideas, which are inspiring me a lot!
Thank you)))
Alexander
(26. April 2020 - 13:48)Thank you, Alessandro!
Sometimes I am thinking about pausing a week or two.
But such comments keep me motivated. 🙂
Alessandro
(26. April 2020 - 13:51)no, please!!!! keep it up!!!!
Alexander
(26. April 2020 - 13:55)??