Last week I decided to show you my performance of 2019. Maybe I will write down the percentages every 6 months. It’s not only interesting for you but it’s a good process for me, too.
And today I want to wish you best returns for your Happy New Year 2020 and I talk a little bit about the market situation and my focus for 2020.
The markets in 2019 and 2020
First for you to know: This section has nothing to do with prediction and I am not an analyst. It’s just my opinion like all sentences on this blog. But I am sure that nobody can predict the future and it’s just interesting to read about different thoughts to form your own view of the markets.
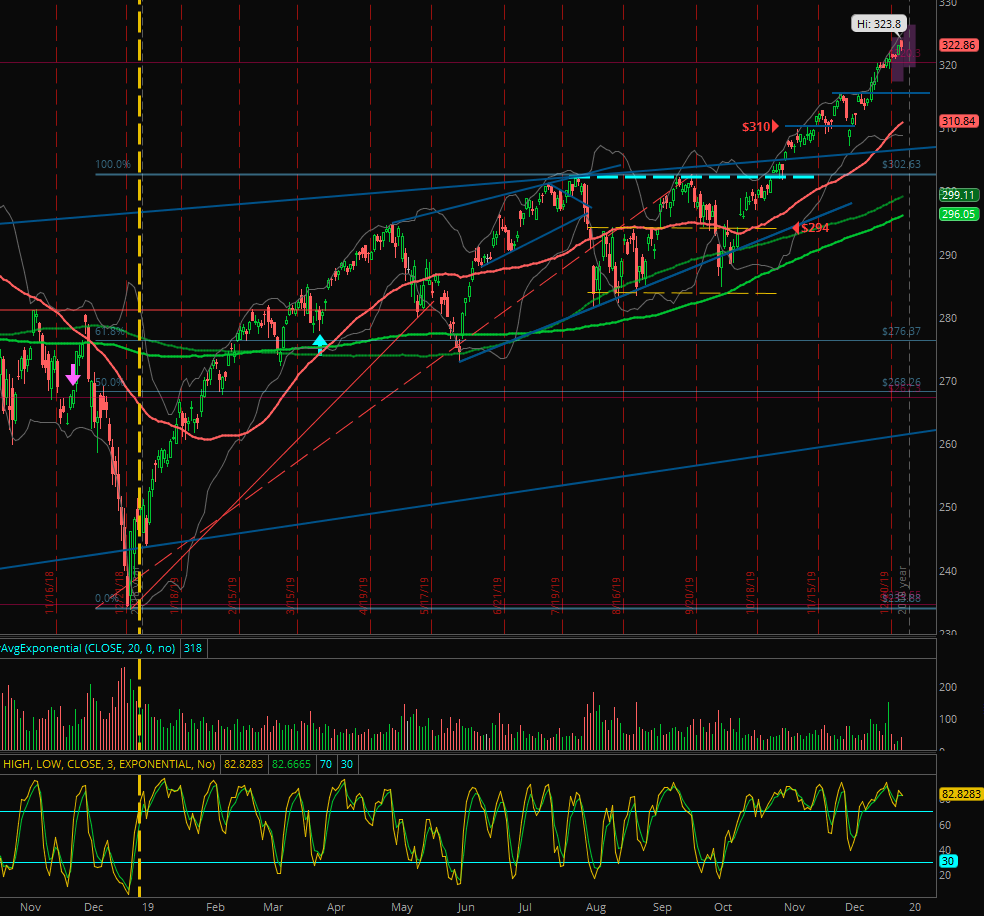
In addition to that I am not starting with the big picture. In the following chart you can see the daily candles of the SPY like in every weekly summary here.
SPY – daily chart

While watching the chart you clearly see the start of the bullish move with its low at Christmas 2018. Then we went into this range. During the sideways move most of the portfolios I know crossed the zero line one or more times. But when re-testing the $302 level for the third time, the breakout happened in October 2019.
And now we’re in a new long uptrend? Is it the beginning? Are we much too overstretched? Will we reach new highs? Will the crash happen in 2020?
… no one knows!
Yes, we are overbought and of course, there will be a reversal to the downside soon. But if it’s to the 50 moving average around the lower bollinger band, the 150 or 200 moving average or just a bounce on the $315 …? I am sorry, I can’t tell you.
What I know is that although we had many green weeks in a row the movement was notable often within the expected move (the weekly EM is calculated by the implied volatility among other values and shows an area where the contract will probably move in the following week). Therefore the market is overbought but there’s no signal for an unusual and insane movement.
But let’s check the weekly chart …
SPY – weekly chart

In the weekly chart you recognize the sideways move in 2018 and the continuation with the Christmas peak in 2019 before the breakout in October.
After the break above the ranging market we had 8 out of 9 weeks in green. Those candles are lined up along a clear trend line without any “errors”. Of course, like I said, we have to expect a correction but I am just cautious.
Let’s sum up:
- Fear & Greed index of CNN is at “Extreme Greed” for a while
- Stochastic and other oscillators are overbought
- no bigger healthy reversal since the breakout happened
- but price within the expected move
- clear uptrend after a long sideways market
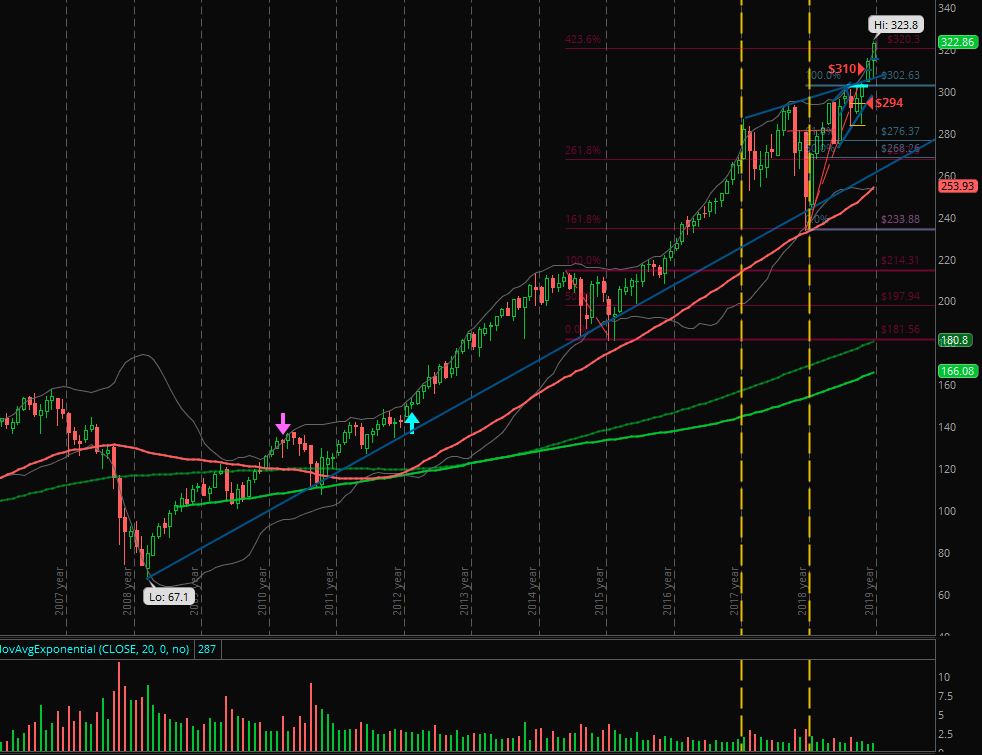
And now for the overall picture we check the monthly chart …
SPY – monthly chart

Did we have 4 green monthly candles in a row already? Yes but rarely. And you can see that the price is far away of the long blue trend line starting in March 2009.
So, the SPY could fall down to $280 next year but because there’s no signal yet the uptrend can hold on for a while.
Let’s analyze this big picture from time to time in the weekly summary here and we will be prepared. What do you think?
New and closed positions
As you know I cleaned up my portfolio and I am almost done. I do not mention my position changes today but I will create an overview for you in one of the next articles.
What I can tell you is that I took some profits and I closed some other positions just because I couldn’t find a strict plan to trade them further. But I can go into details another time if you want.
Final thoughts, focus and questions
After writing about the Dragon Pattern (isn’t it obviously a dragon? 🙂 ) I will finish the last article of the year 2019 with some thoughts, my focus for 2020 and last questions I got from you …

“Dad, it’s not a dragon, it’s a snake!”
“Market and Us” started in October
As you know I started this blog this year. In October I published my first article. Every week there are the summaries with a short market overview and my position changes. And I added some tutorials for coding with stocks and financial data.
You can’t imagine what benefit I have by writing down my weekly thoughts. It’s another level of review when you open it to the public.
Of course, there are still not many readers at the moment but I decided to focus on the content first although I know a lot about marketing. But I did not want to create a “marketing blog”. I want to be true and honest. Writing down what I want to write down.
So, thanks a lot that you are one of the readers and – like I often said – just tell me what you need, wish or want me to add, explain or code! 😀
Financial goal for 2020
My financial goal for 2020 is again to pay my whole expenses only by trading returns without touching my long term accounts.
With new impulses in the last weeks and months and a more and more clearly aligned plan I am confident that I will reach my goal in 2020.
If you found the holy grail already, just tell me. 😉
Questions and comments
Before wishing you the best returns for your Happy New Year I wanted to add that there are still some open questions and comments. The last one was about the percentage of my capital I use for the risk (1R) and how many trades I did in 2019.
I did not want to answer this fast and just with numbers. So, it’s noted down like some other questions and maybe I will add them at the right time to the weekly article or I will post a new article about a special theme. Thanks for your understanding.
Now the best returns for your Happy New Year! 🙂
Thanks again for following my blog, receiving the newsletter and giving me such a wonderful feedback. That motivates me to publish the articles consistently for you.
I wish you that you will reach your goals – the financial ones and the personal ones – in 2020, that you become a better trader in the areas you want to be active and of course, that you will start 2020 in a positive mood, healthy and happy!
Best returns for you and your Happy New Year 2020!
Your Alexander


