Weekly Summary of the stock market
Some of you may know my “Weekly Summaries” I sent regularly in the first half of this year to friends through the messenger Telegram. But because I have so much to say and to show to you, I thought about trying to write a blog. It’s just a trial. You will decide during the next weeks if it is useful for anyone or not.
But let’s start with the first weekly summary of the stock market:
The Market and its range
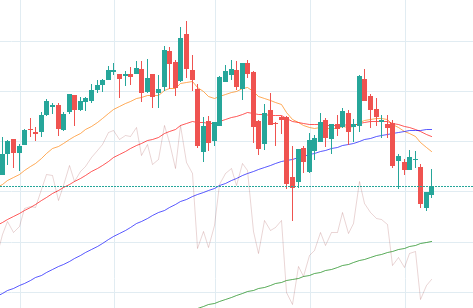
It isn’t easy at the moment. The market, represented by the SPY, is in a range not only for some weeks. I would say that the range started in January 2018. And now the market is indecisive: Recession or good earnings? Good low interest rates or too much corrections with unnatural possibilities? We will see if the SPY can break above the last high, out of the range, or if we’ll test one more time the bottom of the channel.
With this absolute crazy candlestick of Friday’s market movement the probability is rising for … let’s say: more unpredictable weeks. 😉 Such changes in price action are like dojis (see: Candlestick Basics, soon available). Nobody knows where it will lead to.
New positions and reached stops
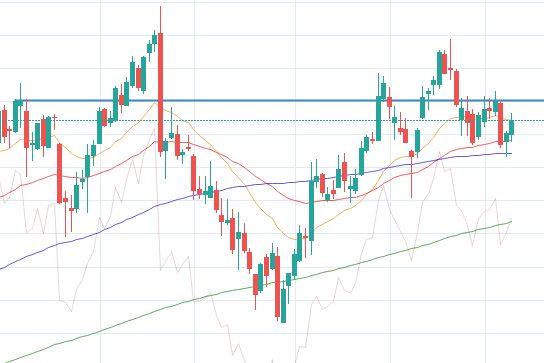
This week I bought additional positions for FB (Facebook Inc.) and UNH (United Health Group Inc.), both companies are fundamentally interesting because the fair value seems to be low.
I wish I had entered FB at the beginning of 2019 but on the long run it will break the ATH at 287.94.

UNH has built a down-channel since December 2018 and it’s currently at the bottom of that channel. I think it’s a perfect entry. In my calculations the fair value isn’t much above the current price level but PEG is around 1.0-1.2 and it’s a big company in the weak Healthcare sector. I expect a recovery the next years.
And I would add my next position if it will make another swing down to the bottom.

ROKU – which I bought at the bottom on 1st of October – had reached my first target at +1R on Friday and MAG was stopped out the same day. I saw it coming but through my statistics I know it’s better to stick with my system than to “improvise”.
With WMT (Walmart Inc.) I picked a runner at the top on Tuesday and the wide stop loss would give the room for the volatile markets.
Focus this week
That’s easy. My focus is this blog. To write several articles to give some life to these pages is what I want to do (see Weekly Summaries for the newest article).
And because I coded 3 new backtests for strategies I will try to explain the results to you. Maybe I will add a little tutorial how to code backtests for yourself.
Write me a note in the comments what’s your wish and ideas for this web place and what you’re thinking about my first article.
Thanks for reading, let’s share our thoughts and knowledge and enjoy your profits!


4 Comments
Paul LaRocca
(14. October 2019 - 14:15)Hi! I see a head & shoulders (bearish) pattern on your chart for Facebook, so it may pull back a little bit and bounce again off your blue moving average (50 SMA?) before moving back up. Or not! lol
Alexander
(16. October 2019 - 23:57)Thank you for your comment. It’s the first one on my blog: Congratulations! 🙂
And yes, you’re right. I didn’t recognize the bearish S-H-S.
But if the bears will play it then the blue line (SMA 100) will be broken in my opinion and the SMA 200 (green) will be the next support. I think that’s what you meant.
Alessandro
(26. November 2019 - 01:28)dear Alex,
I was actually asking myself (as a beginner in long term investments strategies and activities): when you decide to buy x shares of any given stock, which technique do you use to buy those shares? Do you put a LMT order? Do you just buy them at the market order? what do you suggest us to do, and why?
Alexander
(29. November 2019 - 20:58)Try it and use the approach you like. 😀
Sounds funny but that’s what I would recommend. You can buy with a LMT order, with a STP order, a STP LMT or MKT. Whatever you like. It depends on the chart and what you want.
To make it more transparent, I will mention some scenarios here:
1. You see the price of a good company falling and you want to buy cheap. Then maybe you see 3 possible support levels. Why not divide your investment into 3 parts and set 3 LMT orders at those levels, maybe a little bit above the support lines?
2. The price of a company starts with a gap after open because of earnings or whatever and you want to buy at this cheap price. With a LMT you would start to chase the price. You can set a low LMT and then just wait if or if not the LMT is reached or you buy an amount of shares at market price because it’s not important to get it $1 or $2 cheaper.
3. Your favorite company’s price reached a support level and you want to buy. But you are not sure if the price will go lower. You can set a BUY STP LMT above the high of the last candle. If the price will move up, you’re in.
You see? Maybe you understand now?