I started day-trading futures again this month. And I was impressed how the NASDAQ 100 rallied in the late market hours on Friday without taking rest for a day or two.
In this article I will confess that I was totally wrong with my outlook last week and explain what my thoughts are about how long the high quality rubber band in SPY will hold.
Up! Up! Up!
See what a great job the bulls do:

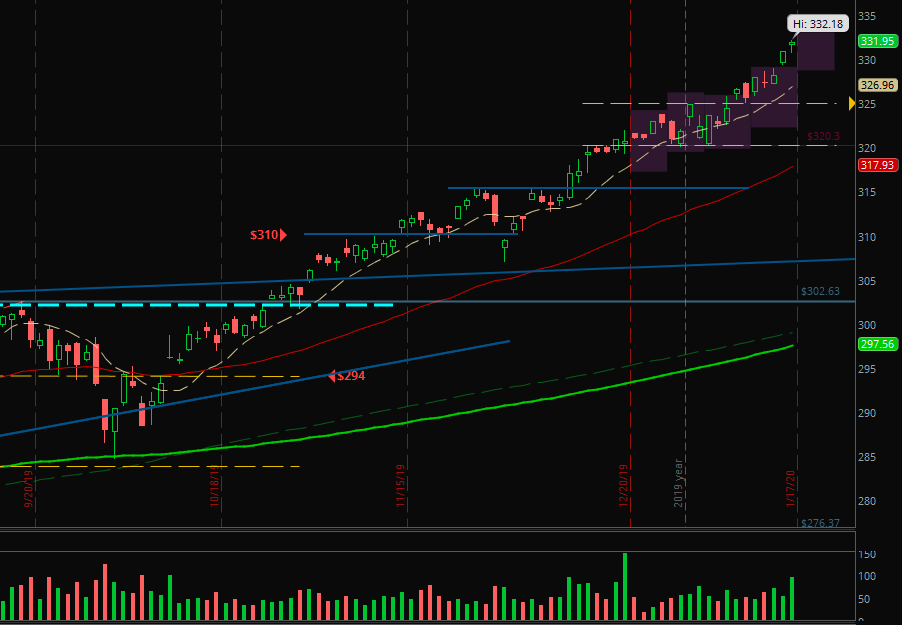
Who told you that the bearish engulfing would lead to lower prices last week? Me? Yes, I am guilty.
I couldn’t imagine that the market would still be so strong. Backwards I recognized the channel like price action between $320 and $325. So, the bearish engulfing was more like a re-test of the upper channel line. And the bulls took the chance to buy in this little weakness.
Next week will be again a 4-day-week. Friday ended with high volume and green. Therefore we again have no conditions yet to justify a pullback.
I always prefer to focus on the candles but let’s look on RSI and Slow Stochastic today:

The above indicators are of the daily chart and range from end of July until now.
You see that both are in a high territory but not in unusual highs.

The weekly chart shows that RSI is in that area of October 2017. If we compare the SPY with those months it should go higher the next three months and then move down for about 11%.
Or maybe we will see the SPY moving with bigger waves sideways in 2020?
After the strong parabolic like bullish move I expect the SPY to pull back in the next 2-3 weeks to at least the $325 level.
But as you know: No one knows about the future. We have to prepare to all scenarios. I did not change anything in my strategy yet. Because I am still bullish until there are clear signals.
I took some profits already but just enough to still have a good position in the market.
Changes in my positions
On Monday I bought TGT which gapped down below my stop two days later. But I am still bullish, so I will manage the trade instead of a strict exit. It founds a bottom and I will play the break out or exit on break down.
RH hit the stop at -1R at the same day and JBL hit the first target.
On Tuesday I bought DEA and two days later BLDR and JBL hit their second target, so both left the last running partial in the market. Perfect in such a market condition.
Friday I took profits on my longer term NKE position. I sold 50%. Also I am looking for a 50% exit on BABA next week.
All in all I finished the week with almost +4R (NKE included).
That’s it for today.
But stop: I coded a first working day-trading automation program. I just started with a moving average signal, so a stock is bought when a 2 minute candle closes above the 9 EMA and it’s sold at a close below the 9 EMA. Of course, it’s not very profitable because sideways moves create big losses. But I want to motivate you to send me your ideas: If you’re idea will be profitable, I will, of course, let the code running for you, too!
The other new articles will be published soon. Thanks for your patience and I am excited how long SPY’s high quality rubber band will hold.
Have a wonderful Monday of education and learning and a healthy, happy week! 🙂


