I am sorry that I am too late and I couldn’t finish the article. But here it is, ideas, trades and overview in the shortest weekly overview I could imagine:
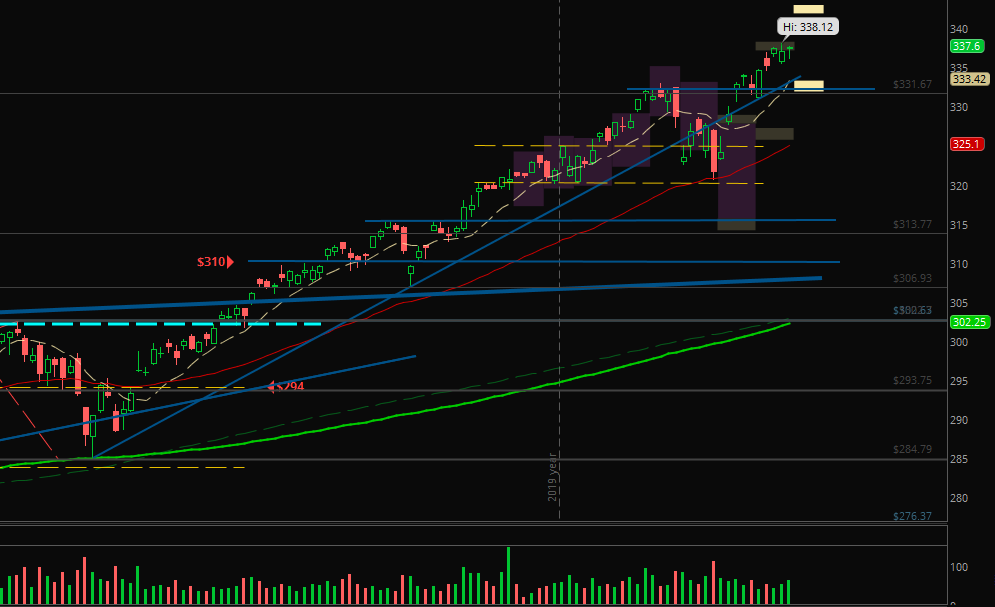
Two strong weekly candles and three days at the all-time-high: SPY is still bullish.
Maybe I should stop writing about my exceptions. Or I should write the opposite. 😉
The Fear-Greed-Index of CNN is measured at 51, neutral. So, there could be at least a sideways movement or a little pullback before we’ll see the next higher highs but no greater bearish signs yet.
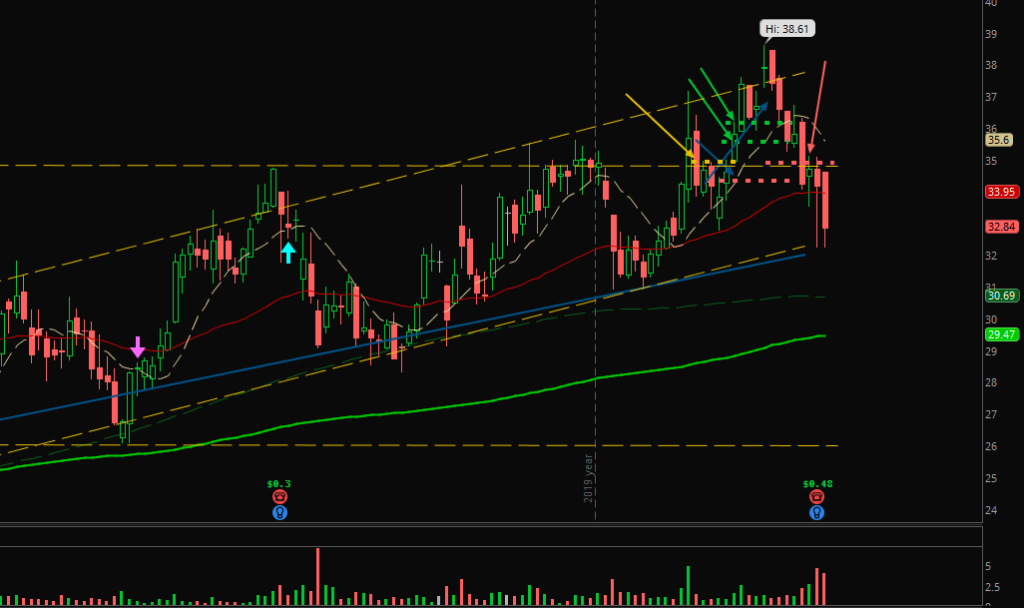
Here YETI, the only position that was closed last week with reaching the stop loss around break even:
I already wrote about the profit targets in one of the last articles.
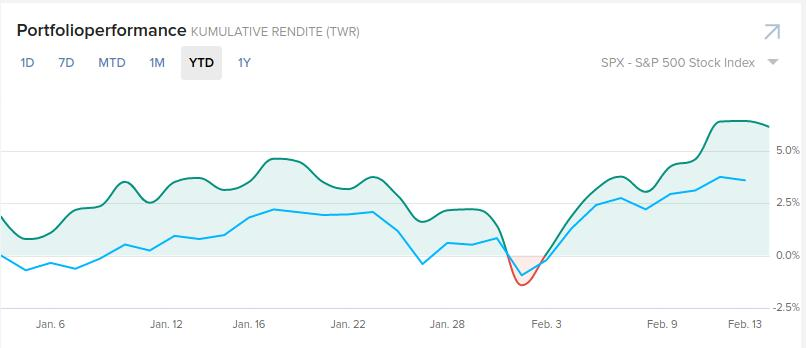
And here you’ll see the performance in 2020 of my trading account (+6.12%):
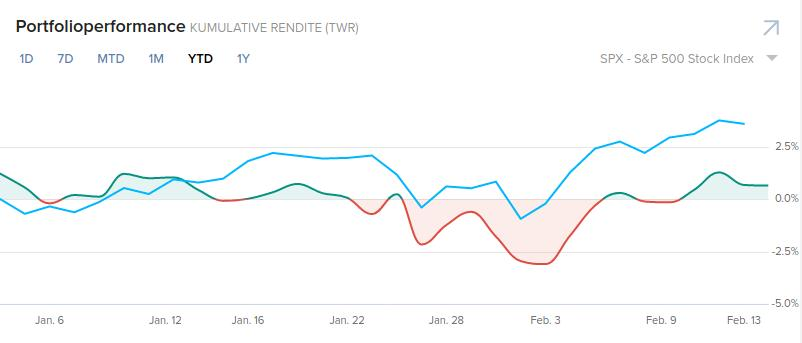
And my investment account (+0.64%):
By paper trading the futures account my performance was +108.4%. That’s the reason I want to focus on futures trading the next weeks to develop my skills.
Again sorry for this shortest weekly overview I could imagine but the next ones will be more detailed again.
Happy trading, good profits and enjoy the markets!