Yes, it’s time for the second weekly summary on this blog. And I am happy that I got the first comment from Paul (thanks!).
This week was a calm week. I checked for possibilities but I did not found any good trades. It’s funny but same happens with stops: None was triggered.
Therefore I will just talk about the market and the development of my picks of last week – the silent week.
Overview
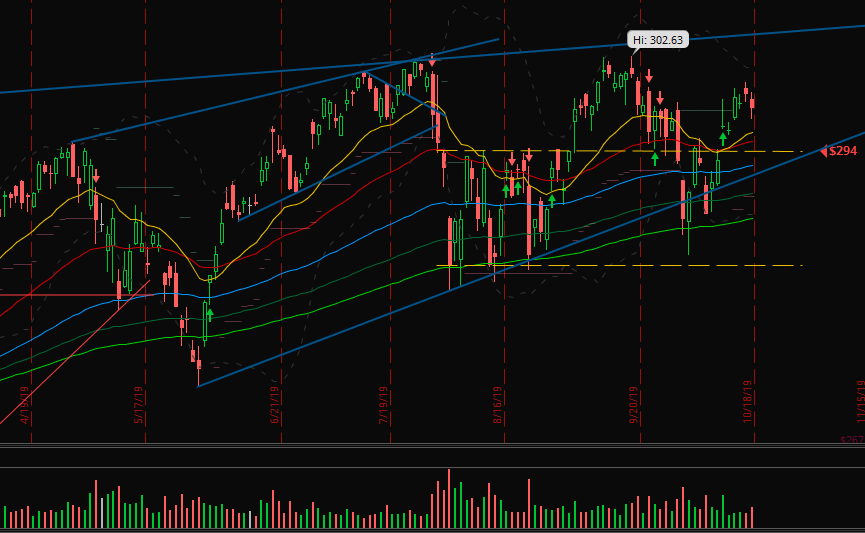
The SPY is showing an interesting candle in the monthly chart. There are about 10 days left but it could become a close next to the high. That’s a bullish sign for November.
Although the stochastics are high.
The S&P 500 with bullish signals
When we look at the daily chart below we see the little range of August, the breakout, the reversal at the last high (=ATH) and then we jumped in the range again. Now it’s the second breakout and therefore a much higher probability that the SPY will bounce of the top of the August channel and then it would be the third test of the ATH – it could break.
For me the probability for this scenario is high. But even with a probability of 99% the market can pick the last 1% and break down in lower regions.
We should watch the move in detail in the next 5 days to know more. The area around $294 is important in particular.

Long term positions of last week
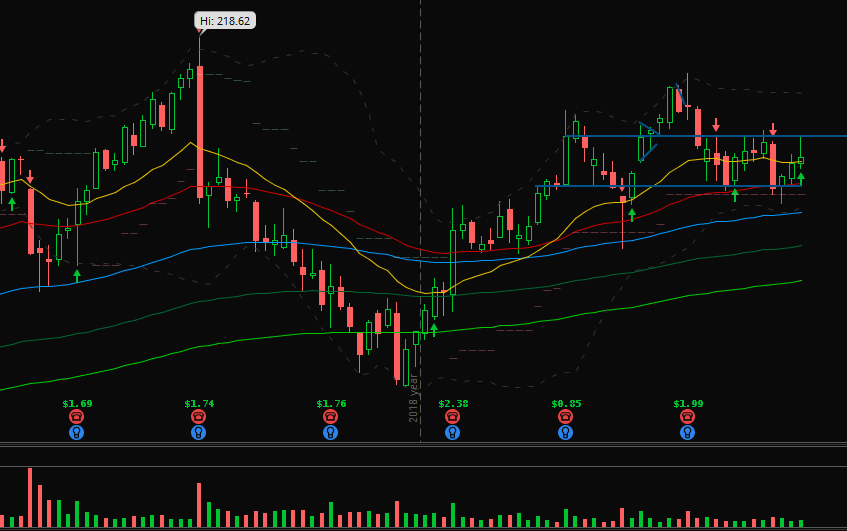
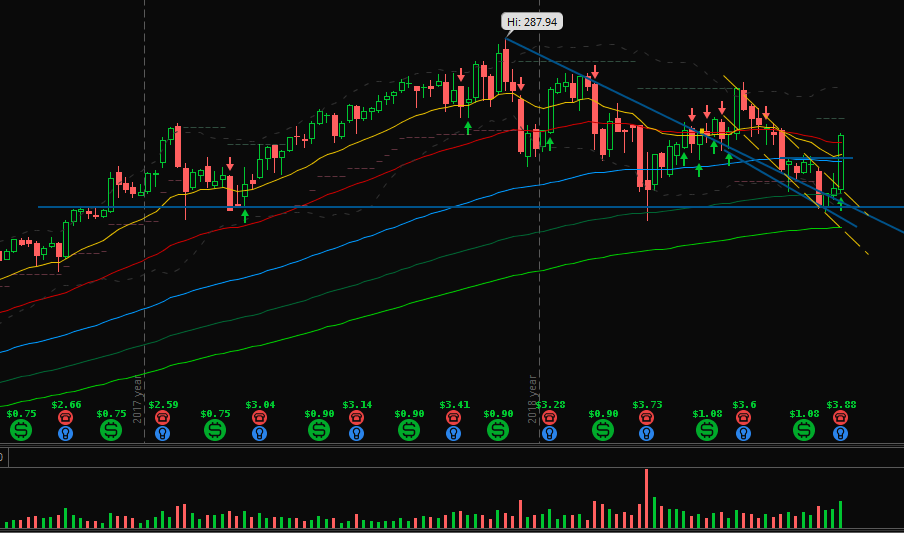
Last week I added positions for UNH (United Health Group Inc.) and for FB (Facebook Inc.).
There were not huge changes but Facebook built a more bearish looking candle, although the body is green. So I think it will form a new lower low. The high hit the resistance and we will see if the strength of the market could support the bulls to form a new high or it will test or break the next support.

UNH showed a more spectacular move. We can see the break above the down channel below with a huge and strong bullish candle closed almost at the high, above the moving averages and with more volume than all the down channel weeks.

The level of $213 seems to be a strong support. This movement reinforces me to look for lows or low points of reversal when I want to invest in a stock long term and to buy several small positions to enjoy the cost average effect and not to wait too long.
That’s it for the current week. I wish you enjoyed my words about the silent week.
Tell me again in the comments what you are thinking about it, your opinions, expectations and experiences. Or ask me for themes you want to read an article of me about.
Best profits for the next 5 days, good picks and healthy, happy days!


2 Comments
Paul LaRocca
(21. October 2019 - 02:09)It looks like you have access to TOS now. Now that many brokers have free commissions, does that change anything for you? For day trading, I currently use TOS for charting and IB TWS for trading. It would be much easier to chart and trade with the same broker, as I would have fewer screens and windows to watch, but I’m concerned about getting bad fills due to less than optimal order routing for commission free trades. I don’t know if slippage would outweigh the commission costs.
Alexander
(21. October 2019 - 14:39)Good question. Interactive Brokers seems to have free commissions for US citizens already and it is planned to transpose that to Europe, too. In addition to that I do not think that IB will cancel its order algorithms because of that. So I won’t change anything at the moment. But of course I will check the next order fulfillments whether I can recognize any changes.
My solution is also based on the fact that I cannot open a real account at TD Ameritrade as a European but it’s a very good tool and the chart annotations do not disappear after being not clicked for more than 3 days … I like my lines. 🙂