Is it the virus? The Brexit? Earnings season? No one knows. But although we had some surprising companies like TSLA, MSFT and AMZN this week, markets are on their way to the 50 EMA.
But: We survived the crazy week at the markets!
What about the SPY?
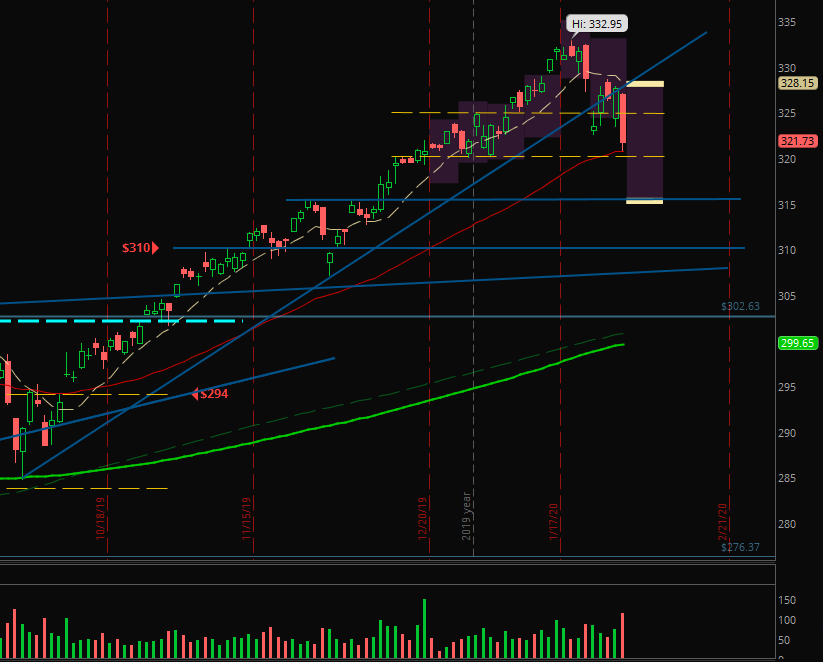
Monday started with a gap down. Then it seemed that the bulls will manage to reach the highs again but especially on Friday we closed down at the 50 EMA, so we hit the as “next support level” declared possibility in my last article.
Now it gets excited because there could be the bounce on the 50 EMA or we’ll see lower prices.
As you can see in the chart above the lower limit of the expected move is exactly at the support level at around $315. So, it is little more likely after the big red candle to hit this level. Except the bulls will be back on Monday. But because of the growing uncertainty of the virus and the stopped flights to China all around the world, the Asian markets will open lower on Monday with a high probability. Therefore I expect the European and US market to follow this price action.
In short: If the Asian and European market will be weak on Monday it is more likely that the SPY will hit the support around $315.
Little BLDR, YETI and some futures…
I thought I had more positions reaching my stops. But it was only BLDR that hit the stop at break even on Friday.
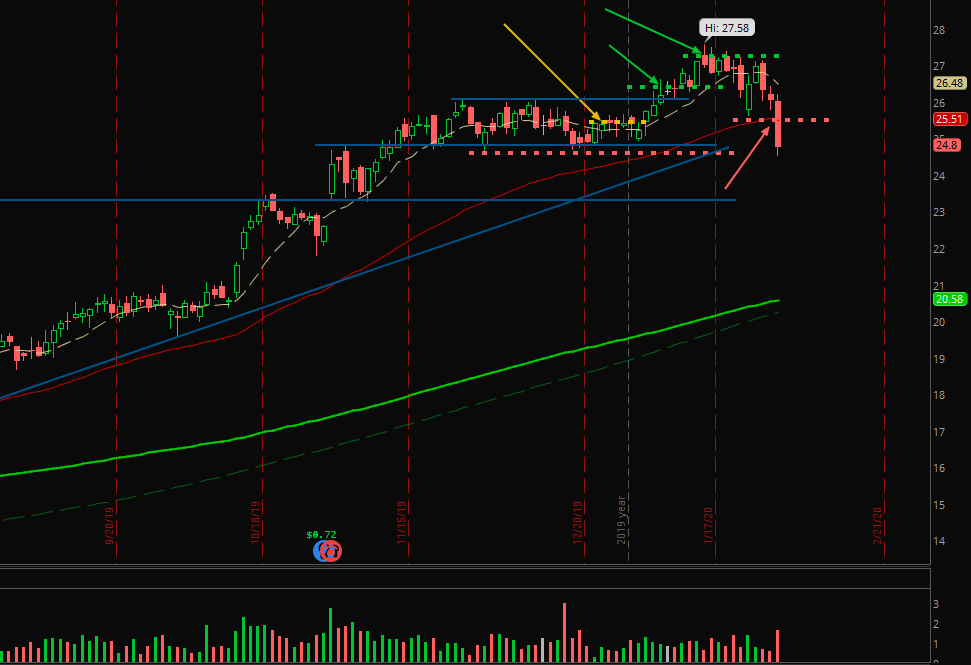
I already took profits at 2 targets. So, I am fine with this trade because only the last runner hit the stop loss.
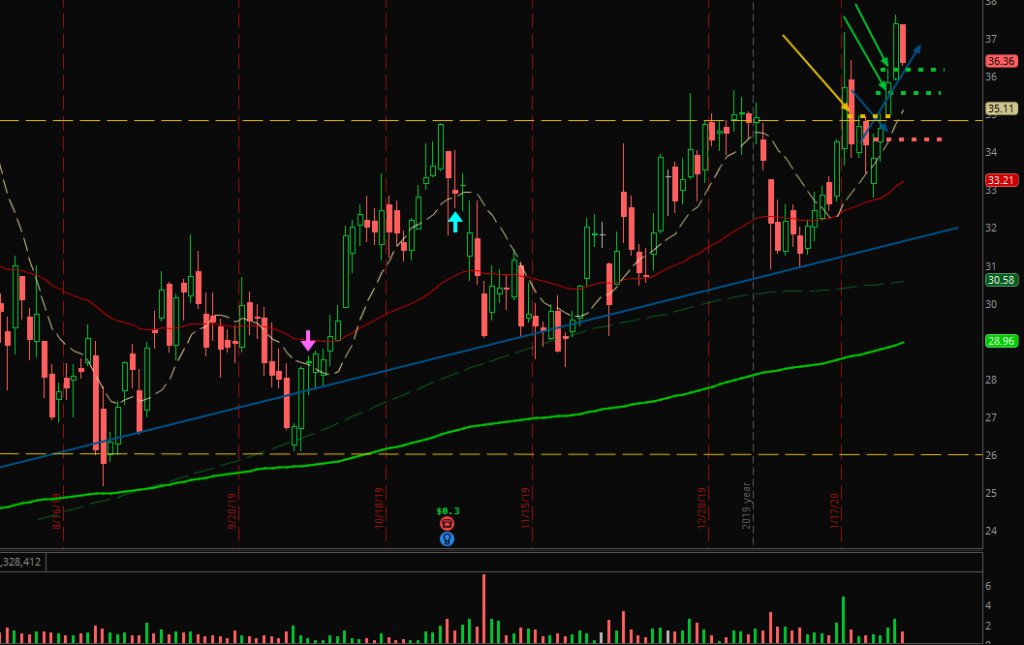
YETI hit two targets on Wednesday although the market was so weak. I traded the breakout of the big picture.
The future trading wasn’t as good as the weeks before. I had the first red days in day trading the micros. As soon as I know what to write about my trading experiences with the futures I’ll write a new article about it.
Yes, I survived the crazy week at the markets. But what about you? Did you also made your way through the crazy week? Did you have many losses last week? What do you expect for the next week?
By the way, again I discovered the ADX as an interesting indicator for the strength of trend. Because I often had ranging stocks in my scans for trending stocks or it was difficult to scan for sideways price action with possible breakout setups.
Maybe you will also profit of delving deeper into the ADX. I used this indicator for one of my first strategies which was a variation of the Turtle strategy.
I wish you good decisions for the next week and a great journey to the targeted profits!