It is important to pick the best trading setups and choose the entry and stop loss wisely. But a very important part for trading success is the best money management.
Before writing about the money management we will look at the market:
The little signal for a healthy reversal

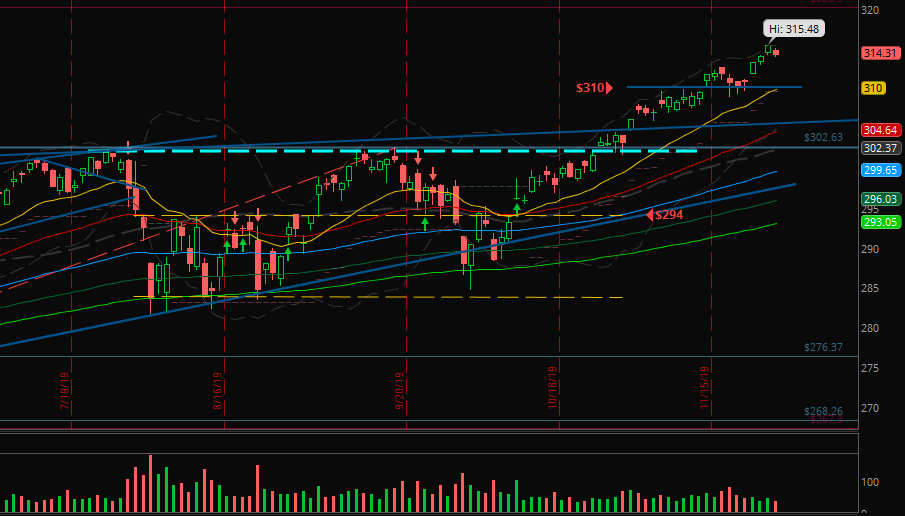
The SPY made its way up more than +4% since it broke out of the range.
And after three green candles a red one with the close below the previous low appeared on Friday. That’s a bearish signal. But because the weekly candle is a bullish one after the previous weekly candle in red, it’s only a weak impulse for the bears.
In addition to that SPY is overbought (stochastic above 80).
The 20 EMA reached the horizontal support at $310. Therefore this level could be a target for a possible move downwards.
But I will wait for Monday’s candle before drawing any conclusion. If we’ll get a lower close than Friday’s low it is more likely to reach $310. If not it is more likely to move sideways a little bit or reaching higher prices.
Good money management?
This week I bought KWEB for long term on Monday. But because US ETFs are not possible for trading in Europe I chose the London Stock Exchange (LSE) for my order.
I am not confident because the mirrored ETF doesn’t move as bullish as the US version in my opinion. I will watch it some more days but if there won’t be a change in price action to put my doubts aside I will close it with a small profit (I wrote about when I am using mirrored stocks for long term investments in this comment reply).

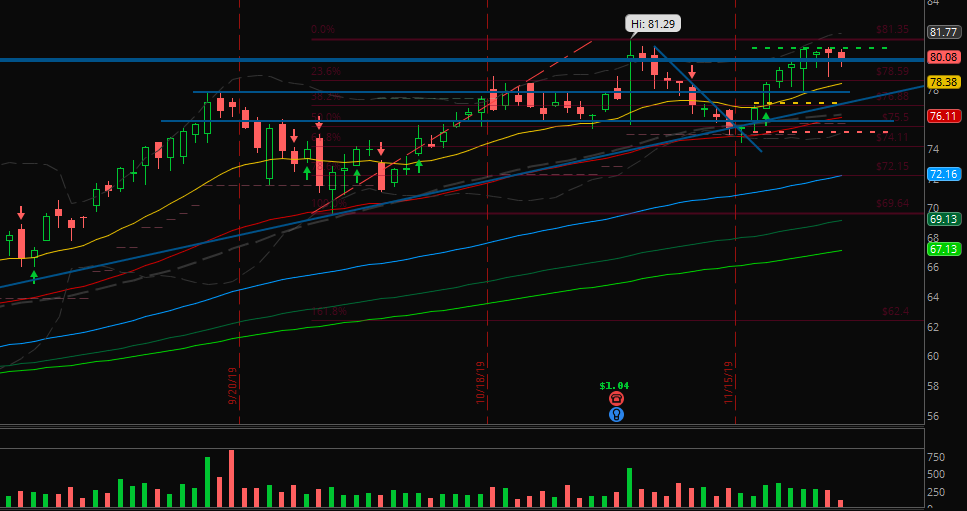
– now with price axis, entry, stop and target (thanks, Filipe and Paul!) –
And one of my newest positions reached its target: ITRI.
For ITRI I did not told you the whole truth. 😉 I decided to trade two approaches taking half of the risk for each of them: One with a wide stop loss and therefore a long way to the target at 2R and one with a close stop loss including a short way to 2R.
And it’s obvious that the wide stop loss is serving more room for the price action to the downside and an advantage for the big picture of a chart whereas the close stop loss has the only advantage in the low distance to the target and being helpful for fast and short impulses.
I am trying both for at least 3-5 months now. It’s more work every day for every trade but this will create statistics for both approaches and after some months I can decide which one fits best to my trading style.
Most important: I will stick to this system – without any improvisations!
That’s what I meant with the title: There are many variations for the money management and my two approaches are little more detailed as I can explain here. I just want to motivate you to think about the money management and if you find two systems you like and you can’t decide which one to trade … just take both, but consistent!
Thanks for reading, thanks for the two new subscriptions to the newsletter, best profits for you in the following week and a wonderful winter and Christmas time!


4 Comments
Alexander
(3. December 2019 - 08:37)Update:
Now as we can see Monday’s close of the SPY, yesterday’s candle almost touched the $310 support level. So, there’s an increased chance for a green candle today, on Tuesday. The bulls are ready to buy at that level and the bears are cautious and wait for a break down below $310.
Alexander
(3. December 2019 - 15:52)Update (9:51am US):
Futures bounced off the trend line above the monthly highs. Maybe the bulls will win the day (Tuesday).
Alessandro
(3. December 2019 - 23:50)dear Alexander,
I know this comment is not related to the content of this (wonderful) post, but I’ll still write it here:-)
Could you give a demonstration on how you use and interpret the Fibonacci tool, to find Fibonacci levels (not extensions) ?
Sometimes I find a Fibonacci level which seems to be correct, but actually it’s not: again a matter of interpretation and experience.
Would you share how you actually interpret/use it?
Alexander
(5. December 2019 - 10:01)Oh, I think I wrote it already: Stick to your system. 😉
It’s easy. But Fibonacci tool is easy, too. Check your trading software if your first click is 0% or 100% (it differs from system to system), then click the high and low in the right sequence. Where’s the high and the low? Move a step backwards and watch the chart. Draw the overall move with your finger, sometimes line chart helps at the beginning because candles can be confusing. That’s it.
If you want you can send me a chart of yours with your Fibonacci levels marked and I will add it in the next weekly summary with a picture of mine if it is different!