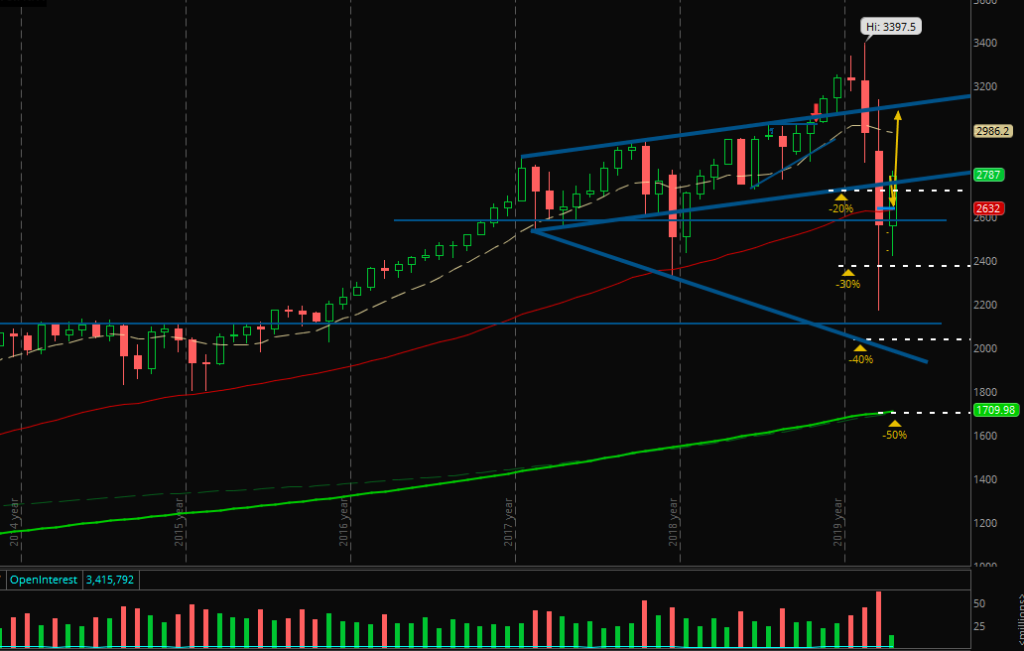
What a nice bullish reversal. But are the bulls strong enough to break through the 50 EMA and the 200 SMA? When will the bears come back?
Possible market moves

After the huge correction with the low at about -36% the bulls started to buy. Last week was extremely bullish and we finished the week above the -20% level and at the 50 EMA in the daily chart (see the ES chart above). For me 3 scenarios are possible:
- Most likely for me is a reversal back to the level of the last high and then again upwards leading to a higher high. This move I drew in the chart with the yellow arrows.
- Or we will see the bulls lifting the price up to the 200 SMA and then down to the 50 EMA and/or the -20% level before moving upwards again.
- If we will break the level of the last high, the bear market will continue and maybe we will see a test of the last low, the -30% level or even the -40% level.
For sure, the bullish price action will end as soon as the FED will stop their buying action. So, we won’t see a new all time high this year in my opinion. And therefore a ranging market is most likely for the rest of the year, maybe longer.
After a confirmation of a sideways market in a range I will focus on swings with a longer term view.
In the monthly chart we can recognize the weak volume relative to the last two months. But volatility in general was so high that I do not use this condition for my expectations:

In the following chart the decrease in volatility is obvious (compare with this article):

One of the good examples in my portfolio
Last week I showed you the good performance of my “long term swing partial” MKTX and today I want to show you my last partial of DEA:

You can see the entry (yellow), inital stop (red) and the two targets (green). Because of the strength of this position I decided to hold through the correction and it was the right decision.
Cool move to the upside, right? I think I will sell at least 50% on Monday because no one knows when the bears will come back. The price action will decide.
And the futures?
The statistic looks bad but I am very happy about last week’s performance because all four numbers are not to difficult to change into a positive result:
Last Week:
• Live account: -$74.42 (2 green days, 1 red)
• Paper account: -$94.50 (3 green day, 1 red)
This Month (April):
• Live account: -$40.26
• Paper account: -$117.54
In paper Monday was full of mixed strategies and I didn’t focus on what I learned before – red day. And on Wednesday nothing worked in live trading because I had no patience to wait for the best setups and changed my plan too fast – red day. But it was a very good lesson because I learned new important parts I didn’t realize earlier so clear.
On Thursday I had the first perfect day: One trade almost hit my daily goal. And that’s what I will focus on next week: Trading one right trade. And waiting for this one with all my patience.
April will still be a good month. I feel it. 🙂
Happy Easter!
Let’s watch the markets and see when the bears will come back. Play the price action, educate yourself and stay healthy!


