This week wasn’t boring!
Because of the earnings season there were lots of setups I watched and analyzed. And, of course, I had some new positions. But first we will check if the SPY will breakout …
The SPY in good position
Will SPY breakout happen?
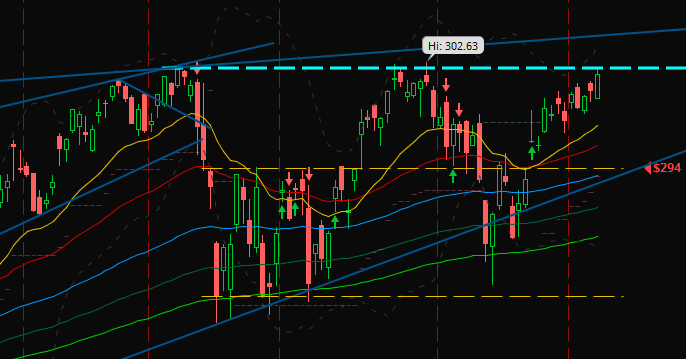
Last week I wrote about the channel breakout and that the second breakout has a higher probability of reaching significantly higher price regions.
And with the candle of Friday we dipped the breakout level.
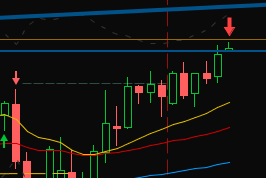
While writing this article on Monday morning (German time) the ES – symbol for the S&P 500 E-Mini Future – went a little bit higher than the last high but turned down. It’s still a green candle.
Update: About 2 hours before market open the close has reached the high of the candle.
For me, those elements together are building a bullish scenario increasing the probability of a SPY breakout to a new all-time-high. It could be a false breakout. So, if anyone wants to trade the SPY I would wait for a pullback to the breakout level.
It remains exciting how the markets will move to the start of the week.
One short and two long
Changed positions of my trades
Immediately on Monday my order for a short position on TCMD was triggered.
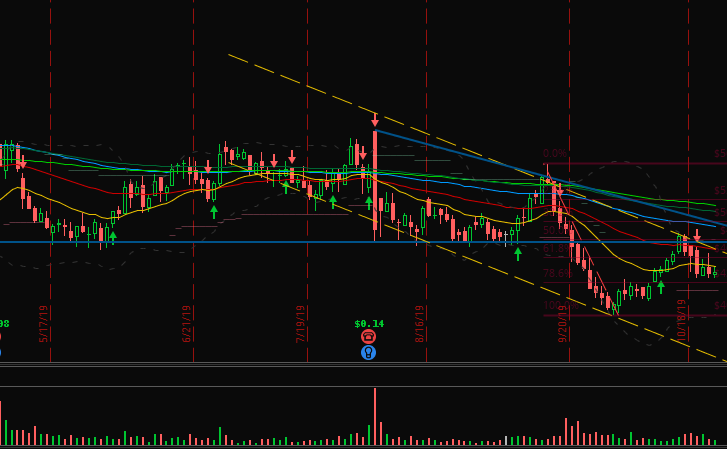
Wonderful to have 5 signals for shorting:
- price action was in a perfect down channel,
- reached the resistance of several previous lows,
- touched the 50.0% fibonacci level
- and price formed a tweezer top exactly at the upper channel limit. Also the stochastic was above 70.0
The last week’s candles are supporting my idea. I set my target around the last swing low.
In addition to this new trade two of my running trades hit their first target (50% at 1R): NVDA on Tuesday and EGP on Thursday. Now both of them are on their way to their second target at 3.5R.
If you’re wondering why I picked such “crazy” targets: I analyzed all my closed trades for the best combination of two targets and received this relationship (if you are interested post in the comments that I should write about the code for this optimization). But it’s so much work with the order setting, changing and the trading journal entries that I broke it down the easy and well-known target at 2R. It’s leading to less profits according to my statistics but the fact that it’s much easier to handle and better for the clear overview of all trades that I compromise here.
Earnings offer cheap entrances
After all those gaps down and big red candles I took two new long term positions: MCD and YUM.
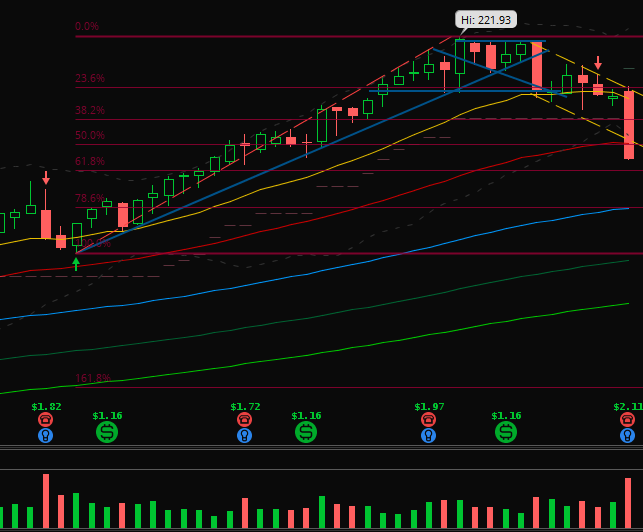
For MCD I watched the down channel for some weeks and because the price reached the bottom of this channel with a gap and a big red candle around 50.0% fibonacci level, I bought the next day within this doji like candle (Wednesday).
But you can see that the last days of the week MCD fell another -2.5%. But it was a first small position so I will watch where a bottom could be found.
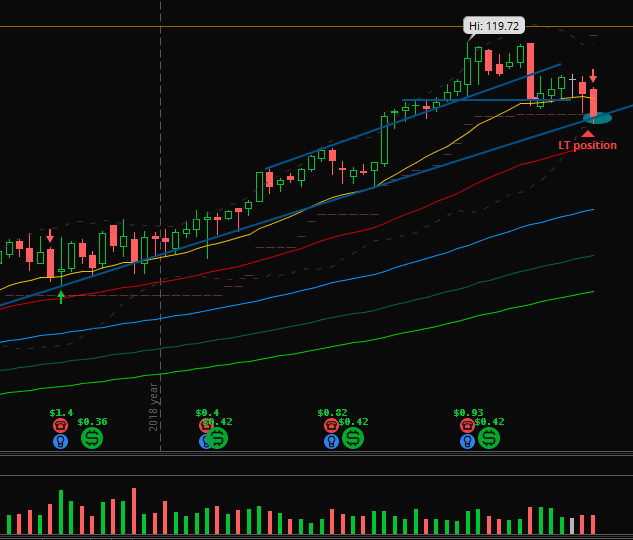
For YUM it’s easy: I waited a long time for the next fast down move to and the bounce at the long trend line which can be obviously seen in the weekly and monthly chart.
It dipped the trend line and I bought my first position. Watching the candlesticks you can recognize that it’s a strong support and the probability is high that price is building its low the current days.
That’s it. Thank you for reading my weekly summary today and you would make me happy with a comment of your thoughts, ideas and opinions!


